Beware Of Grasping at the Shadow
July 31, 2023
Beware lest you lose the substance by grasping at the shadow.
—Aesop
The world of investing is often clouded by the allure of being right: the shadow, as Aesop would say. In our view, this loses sight of the substance: the consistent, systematic process that forms the heart of sound investing.
We believe that a trend-following strategy embodies this substance. It does not get lost in the shadow of predicting market highs or lows, and it does not require cherry-picking a historical chart that best supports a preferred argument about the over- or under-valuation of an asset. Instead, trend following observes, understands, and responds to market trends. The divergence between the equal-weighted and market-cap weighted S&P 500 indices this year underscores why we find wisdom in this approach.
Being right in markets typically translates to picking the top or bottom in a particular stock or asset class. Unfortunately, the market’s inherent complexity defies flawless solutions. Winning, in our view, means focusing on the substance: rigorously employing our systematic investing process, attempting to maximize compounding rates, and adapting to prevailing market conditions.
We spend no time trying to predict what will happen in any moment other than now, and we think our systematic investing process demonstrates resiliency in being able to capitalize on what’s working in the moment. This is the essence of our approach: not grasping at the shadow of being right but focusing on the substance of our process.
In our latest Monthly Note, we delve into the data behind the above-average start to the year for the S&P 500 and Nasdaq. We discuss the emotional biases that can cloud investors’ opinions of how the rest of the year will actually play out, and we discuss the discipline required to stay on the path regardless of the outcomes.
But first, here’s a summary of the global asset classes utilized in our portfolios and their exposures for August.
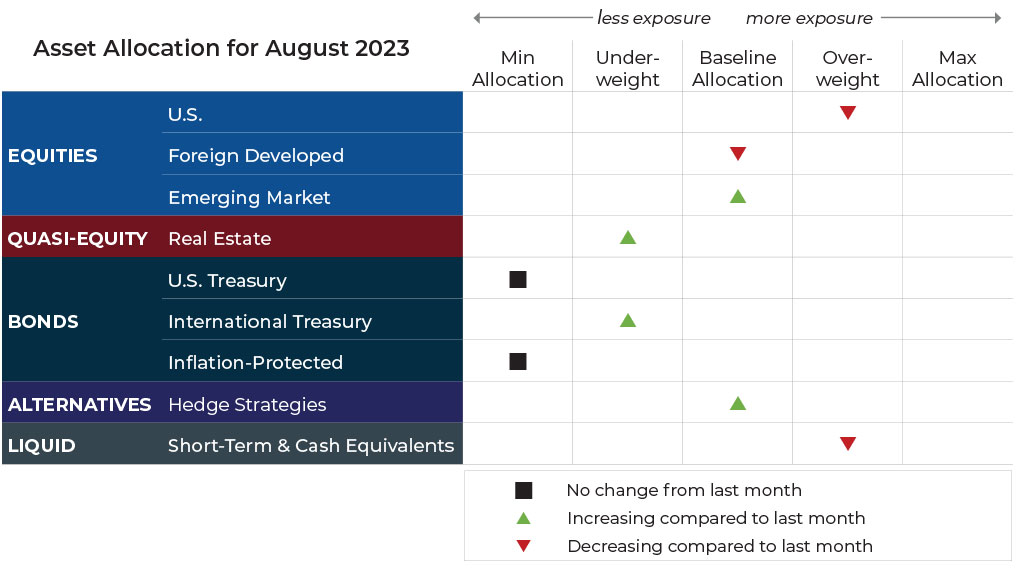
Asset Allocation Update

Source: Blueprint Investment Partners
Adjustments can vary across strategies depending on each strategy's objectives. What's illustrated above most closely reflects allocation adjustments for the Growth Strategy. Diversification does not guarantee investment returns and does not eliminate the risk of loss. Diversification among investment options and asset classes may help to reduce overall volatility
U.S. Equities
International Equities
Overall exposure will not change. Foreign developed equities continue to experience uptrends across both timeframes, but it will return to baseline allocation due to returning a portion to emerging markets, which are experiencing uptrends across both timeframes for the first time in more than 18 months.
Real Estate
U.S. & International Treasuries
Exposure will increase slightly but remains underweight. International bonds picked up an intermediate-term uptrend, but all other segments and trends remain negative.
Inflation-Protected Bonds
Exposure will not change and is at its minimum allocation due to downtrends across both timeframes.
Alternatives
Exposure will increase to baseline allocation due to the emergence of an intermediate-term uptrend.
Short-Term Fixed Income
Exposure will decrease, as it is handed back to other strengthening segments.
Asset-Level Overview
Equities & Real Estate
In July, U.S. equity markets continued the broad climb that started in June, as all major classes produced strong returns. For the first time in a while, growth and tech took a backseat to value, high-dividend, mid, and small caps, as the lagging segments attempted to close the performance gap from the first half of 2023. While they still have a way to go, July’s return cemented what is quickly becoming one of the best calendar starts for equity performance in multiple decades. Later in this Monthly Note we will address this in more detail, but the summary for now is that exposure will continue to be overweight in U.S. equities.
Foreign developed equities and emerging markets also performed well in July. For the former, uptrends remain entrenched, exposure will continue to be at the baseline level, but a portion of the allocation will be handed to emerging markets due to their strengthening trends. For the latter, July’s rally marked a return to long-term uptrends, with exposure increasing as a result. It is the first time EM experienced uptrends across both timeframes since November 2021. While the mix is changing, the overall exposure to international equities will not change and will be at their baseline levels across our strategies.
With peak rates potentially in sight, real estate securities have recovered enough to create an intermediate-term uptrend, but the long-term trend remains negative. The result will be an increase in exposure, which will be taken back from U.S. equities, but the asset class will remain underweight overall.
Fixed Income & Alternatives
Fixed income returns were mixed in July, with most slightly negative except international bonds. Downtrends remained pervasive, but an intermediate-term uptrend internationally will cause a slight increase in exposure overall. Allocations will remain underweight across the board. Yields remained strong on very short-duration instruments, so non-equity exposure in our strategies will reside primarily in ultra-short duration.
Gold rebounded in July and pushed back to uptrend status across both timeframes. The result is a return to baseline allocation in our portfolios.
3 Potential Catalysts For Trend Changes
All Done? The Federal Reserve and European Central Bank both raised their key interest rate by a quarter percentage point this month. This is the 11th rate hike for the Federal Reserve, and it raised the benchmark rate to a 22-year high of between 5.25% and 5.50%. The ECB’s ninth rate hike also brought their benchmark level to a 22-year high of 3.75%.
GDP Wow: Gross domestic product grew at a 2.4% annual rate in the second quarter. This was faster than many economists expected and higher than the 2% growth in the first quarter. Consumer spending slowed but was high enough to drive growth, along with stronger business investment. Combined with a strong labor market, this report raised hopes that the Fed will be able to achieve their goals of a soft landing for the economy.
It’s All About the Consumer: U.S. consumer confidence rose to its highest level in two years this month. The data reflects a strong labor market and easing inflation. On all three measures of consumer confidence –the overall index, future expectations, and present situation – consumers reported higher levels of confidence.
Let The Good Times Roll
Man cannot control the current of events. He can only float with them and steer.
—Otto Von Bismarck
Last month we highlighted the hilarious absurdity of making predictions about the market. Coming out of a negative year in 2022, it is perhaps no coincidence that the most comical (in hindsight) of those predictions were those rooted in recency bias and centered on the idea of continued negative performance in 2023. After another strong month of equity performance, it got us wondering where 2023’s performance stands in relation to history.
Should we be happy? Should we be worried? These are relevant questions we hope to answer, which we hope will provide valuable context for you.
Looking at past performance is of course potentially dangerous, but it can be useful to maintaining what the late Trevor Moawad called “neutral thinking” in his book, “It Takes What It Takes.”
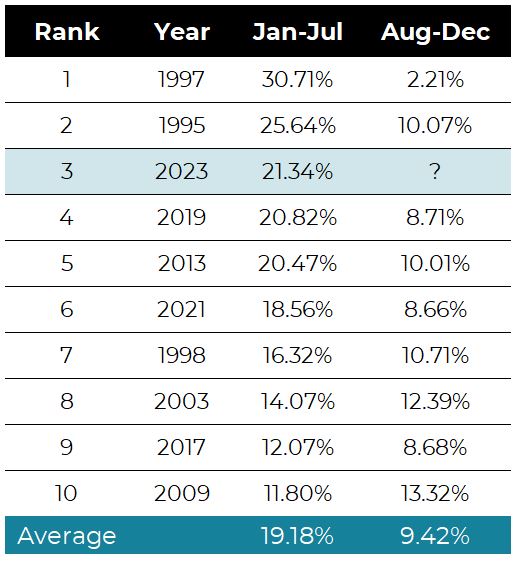
For example, if I’m pessimistic or worried about the market or economy, it might be helpful to know that we are having the third best start in the S&P 500 Index in the last three decades.
Best Starts to the Year for the S&P 500

Source: GFD, SPDR S&P 500 ETF Trust (SPY), 2/1/1993 to 7/26/2023
The only two years better than 2023 are 1995 and 1997. The years right behind 2023 are 2019 and 2013. All four of those were very positive environments both from an economic and market standpoint.
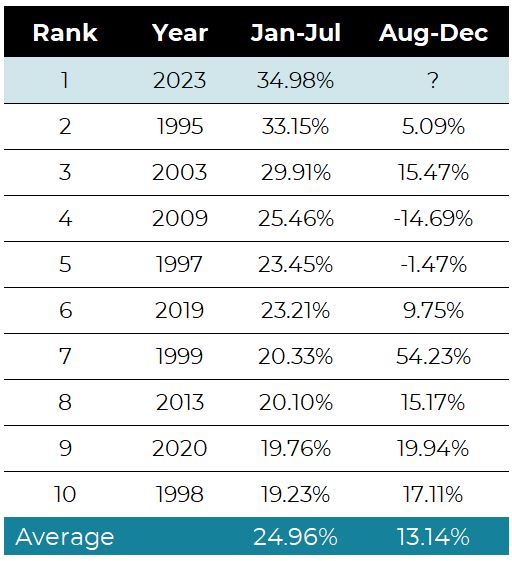
If you look at the Nasdaq, it’s even more positive. In fact, 2023 is the best start for the index over the last 30 years, with 1995 being second.
Best Starts to the Year for the Nasdaq

Source: GFD, Nasdaq Composite (^IXIC), 1/1/1993 to 7/26/2023
If you’re a pessimist, the knowledge of how good this year has been might frighten you further because it could confirm a bias that things are overvalued. However the data, small though the sample might be, says otherwise. Of the top 10 best starts in the S&P 500 over the last 30 years, the average return from July to December is 9.4%, as the table above summarizes. The Nasdaq paints a similar picture. While there are a couple of negative finishes to the last five months sprinkled in, the average is more than 13%, and the median is more than 15%.
Now, lest we steer our emotional vehicle from one ditch of worry and fear to the other ditch of irrational optimism and risk-seeking, we must remember that we can’t make predictions about how the year will finish. The beauty of using a systematic investing process is that we don’t have to. Having a system allows us to simply be at peace with where we are, enjoying the fact that we are likely well-positioned for the given set of circumstances – but also feeling relatively assured that we will pivot if necessary.
Trend following often invites bias-based critiques from observers. Pessimists may question a seemingly-slow exit during a market drop, but stay silent when the trend reverses. Similarly, optimists may criticize our re-entry timing, yet remain content with positioning when the market is falling. Among those who don’t yet fully understand and embrace the potential value of trend following, there seems to be a prevailing feeling that our systematic investing process could put us in a difficult position from which it might seem impossible to recover the anticipated opportunity cost.
What the Monday morning quarterbacks fail to realize is something we determined in our research 20 years ago, validated during the subsequent two decades, and see yet again in 2023 thus far: The potential advantage of a trend following system is that, while it can be slow and take years to play out, if you stick with it you may end up in great spot relative to the alternates.
Let's Talk
If you have any questions about what transpired in the markets last month or portfolio positioning for the month ahead
